

First steps with Memgraph


In this tutorial, you will learn how to install Memgraph Platform, connect to it using Memgraph Lab, run your first query and style your graph. You will see that using Memgraph is not hard at all!
This tutorial is also available as a video on Memgraph's YouTube channel:
Prerequisites
Memgraph Platform can be installed only with Docker. Instructions on how to install Docker can be found on the official Docker website.
1. Install Memgraph Platform
First, you need to download and install Memgraph Platform. All you need to do is to open a terminal on your computer and run the following command:
docker run -it -p 7687:7687 -p 7444:7444 -p 3000:3000 -v mg_lib:/var/lib/memgraph memgraph/memgraph-platform
Once the installation is done, you will see a message similar to this one:
Status: Downloaded newer image for memgraph/memgraph-platform:latest
Memgraph Lab is running at localhost:3000

mgconsole 1.1
Connected to 'memgraph://127.0.0.1:7687'
Type :help for shell usage
Quit the shell by typing Ctrl-D(eof) or :quit
memgraph>
That means that you have installed Memgraph Platform and that you have Memgraph up and running. Kudos!
2. Connect to Memgraph Lab
Since you installed and started the Memgraph Platform, then the Memgraph Lab is
already running, so open your web browser and go to localhost:3000. When the Memgraph Lab loads, click
Connect now.
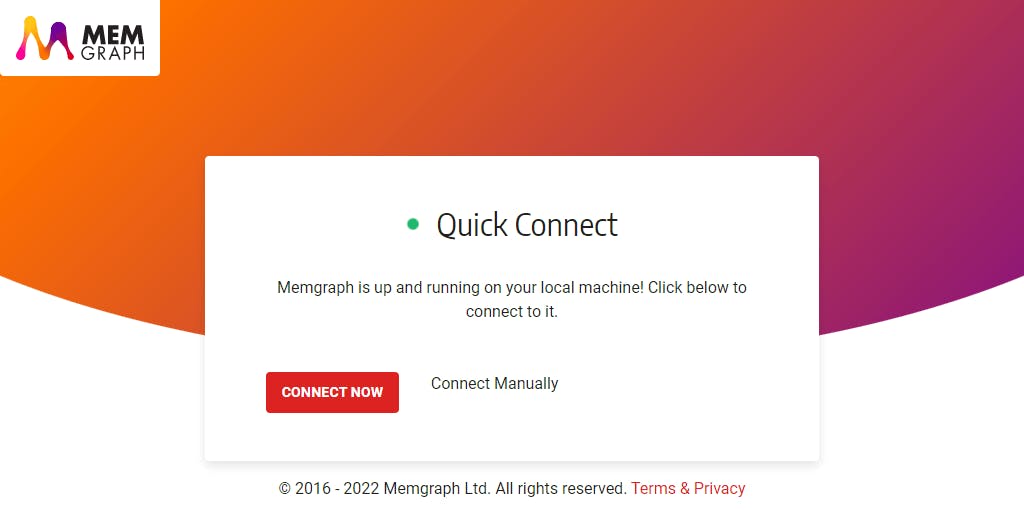
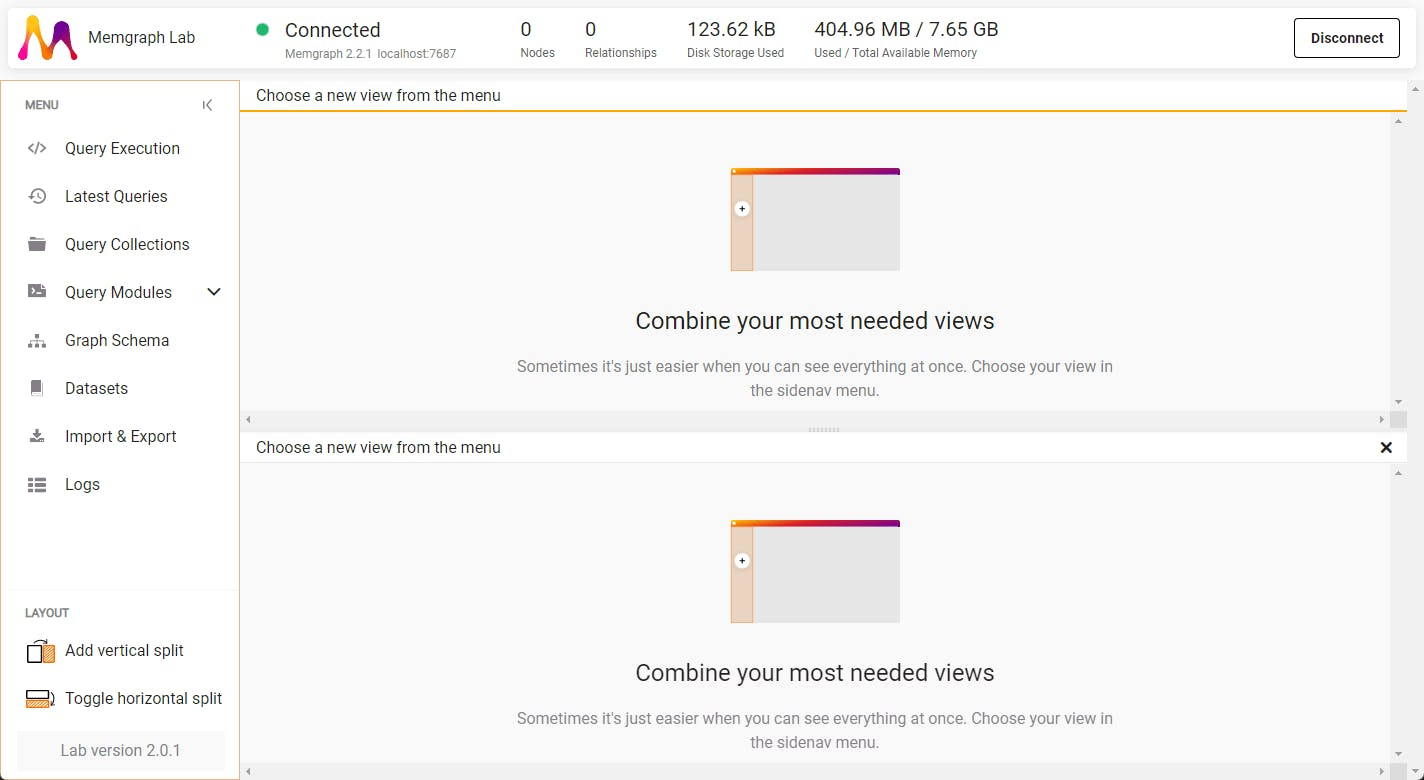
That's it! You can see the Memgraph Lab Dashboard, so you are ready to head over to the next step.
3. Import dataset
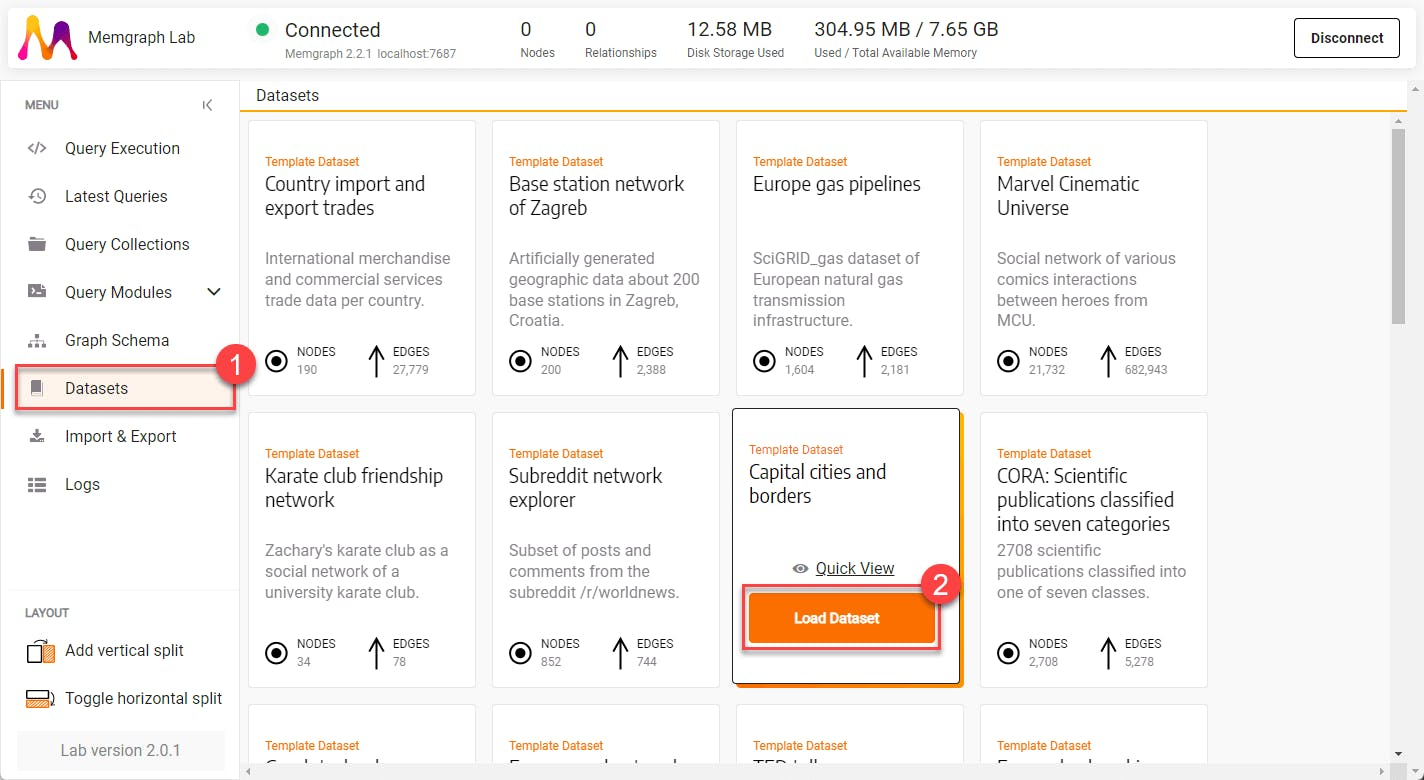
Since this is a fresh install, there are no nodes and relationships in your database. We have prepared more than 20 datasets that you can use for testing and learning. You will now import one of those datasets. In the sidebar click Datasets. Next, go to Capital cities and borders and click Load Dataset.
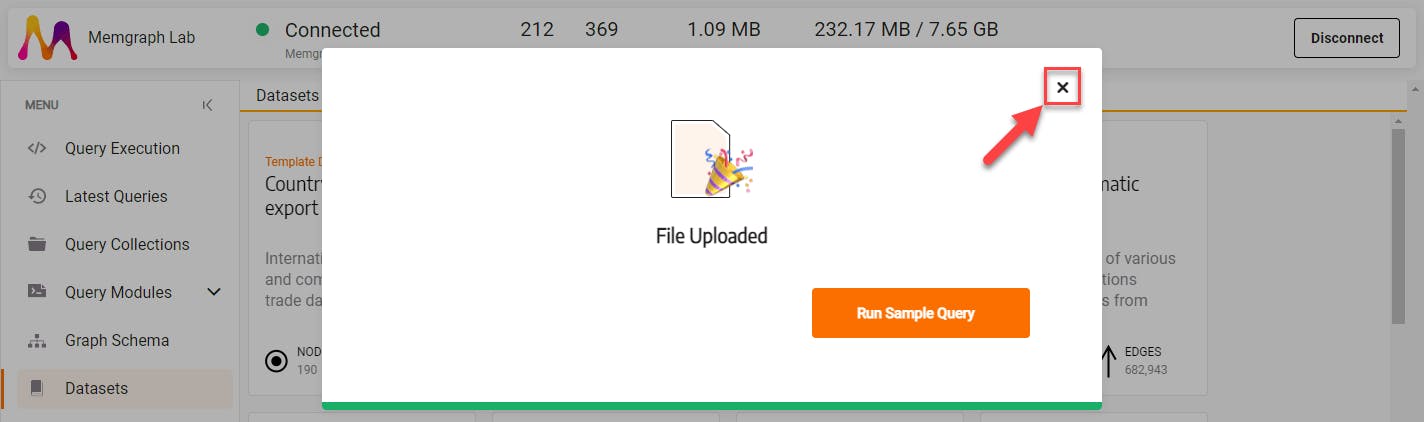
You will see the warning that a new dataset will overwrite current data in the database. That is not a problem for you since you don't have any data in your database, but in the future be careful when importing data. Go ahead and click Confirm. Once the import is done, click the X to close the dialog.
4. Run query
Now that the data is imported it is time to run your first Cypher query. You will write a query that that displays all of the cities and all of the connections.
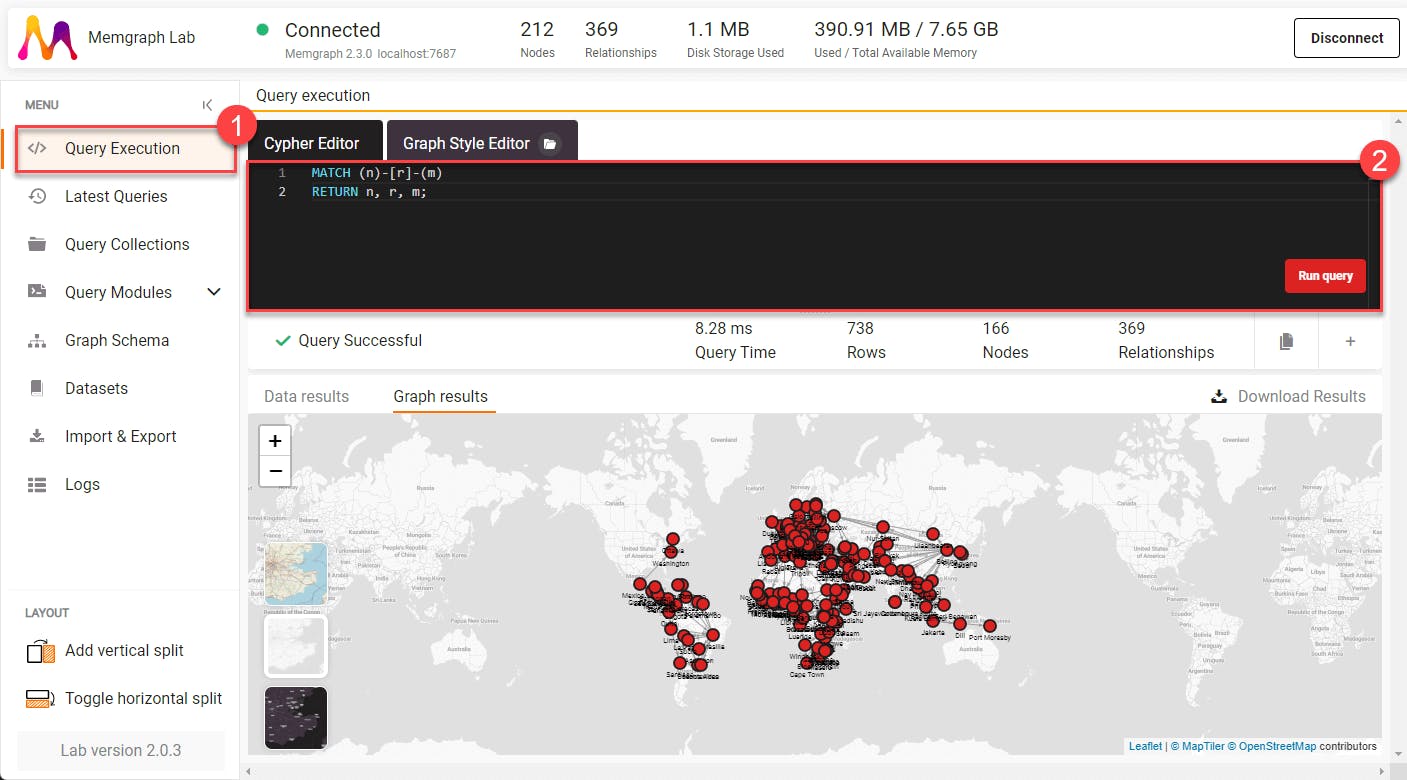
Click the Query Execution in the sidebar, and then copy-and-paste the following code into the Cypher Editor.
MATCH (n)-[r]-(m)
RETURN n, r, m;
Click Run query to run the above query and see the result in the Graph results tab.
Here is another query for you. Imagine that you are in Madrid and you want to visit other capital cities that are one or two hops away from Madrid. How can you figure out which cities are your possible destinations? You will use Cypher query language to find that out.
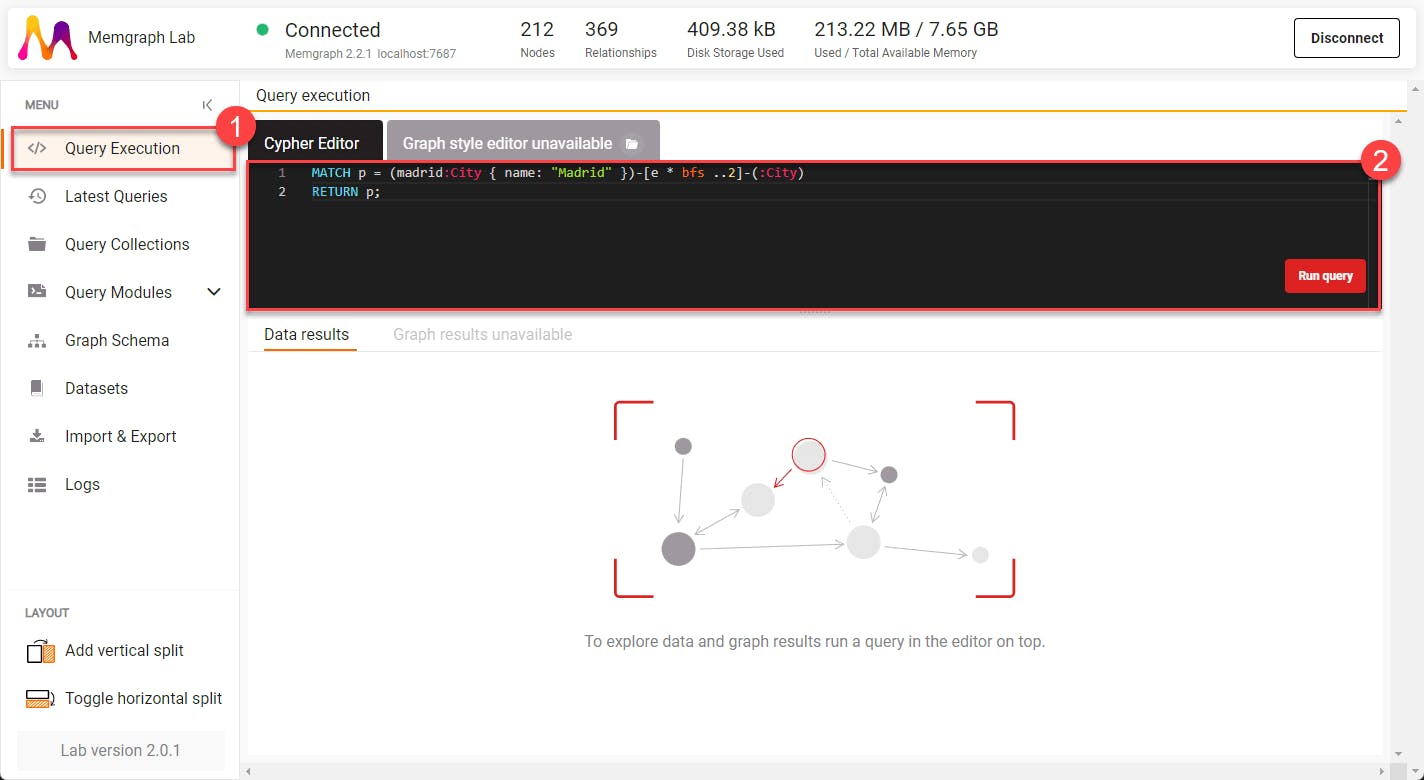
Click the Query Execution in the sidebar, and then copy-and-paste the following code into the Cypher Editor.
MATCH p = (madrid:City { name: "Madrid" })-[e *BFS ..2]-(:City)
RETURN p;
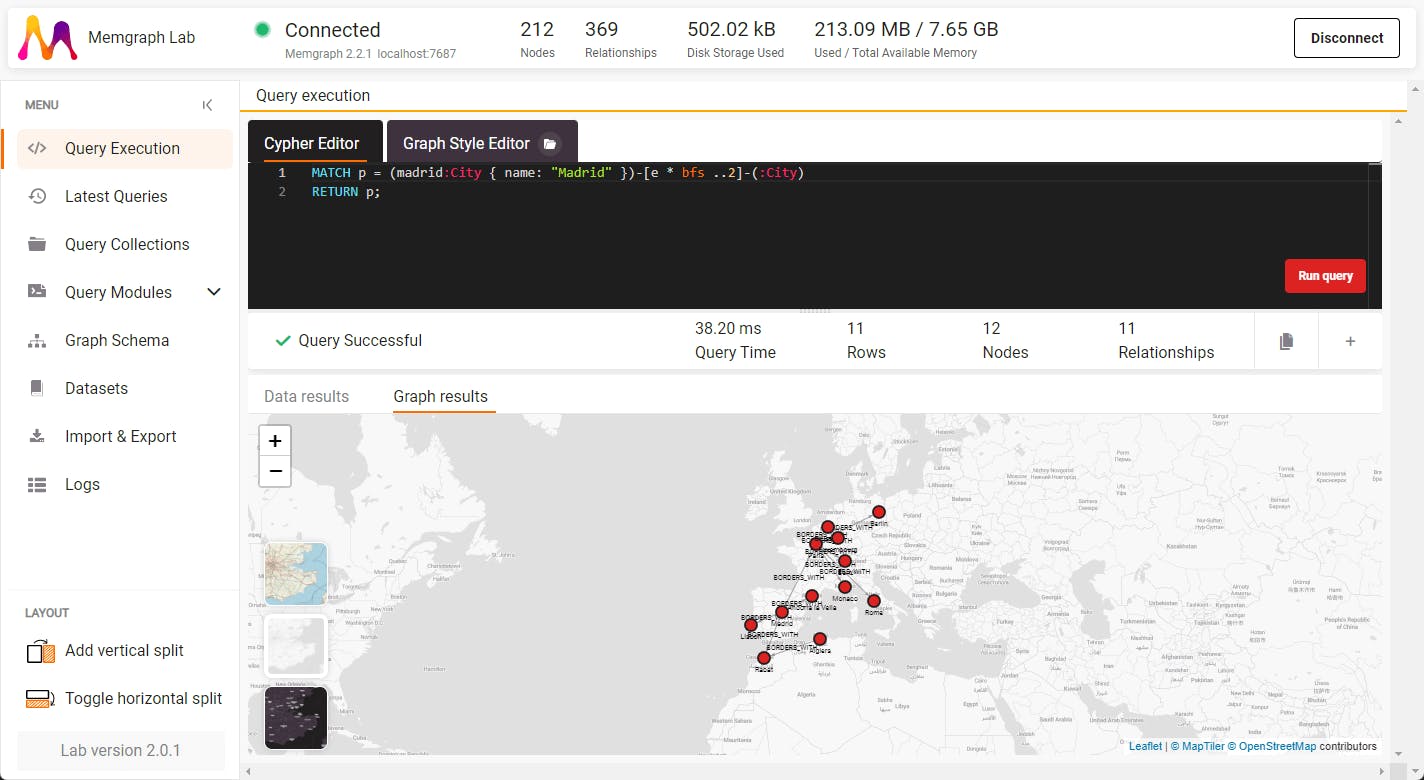
This query will show all of the capital cities on the map that are up to two hops away from Madrid. You don't have to worry about exact semantics of this query for now, but if you want to find out more, check out the learning materials for Cypher. Click Run query to run the above query and see the result in the Graph results tab.
The result that you can see shows all of the capital cities that are two hops away from Madrid.
5. Style your graph
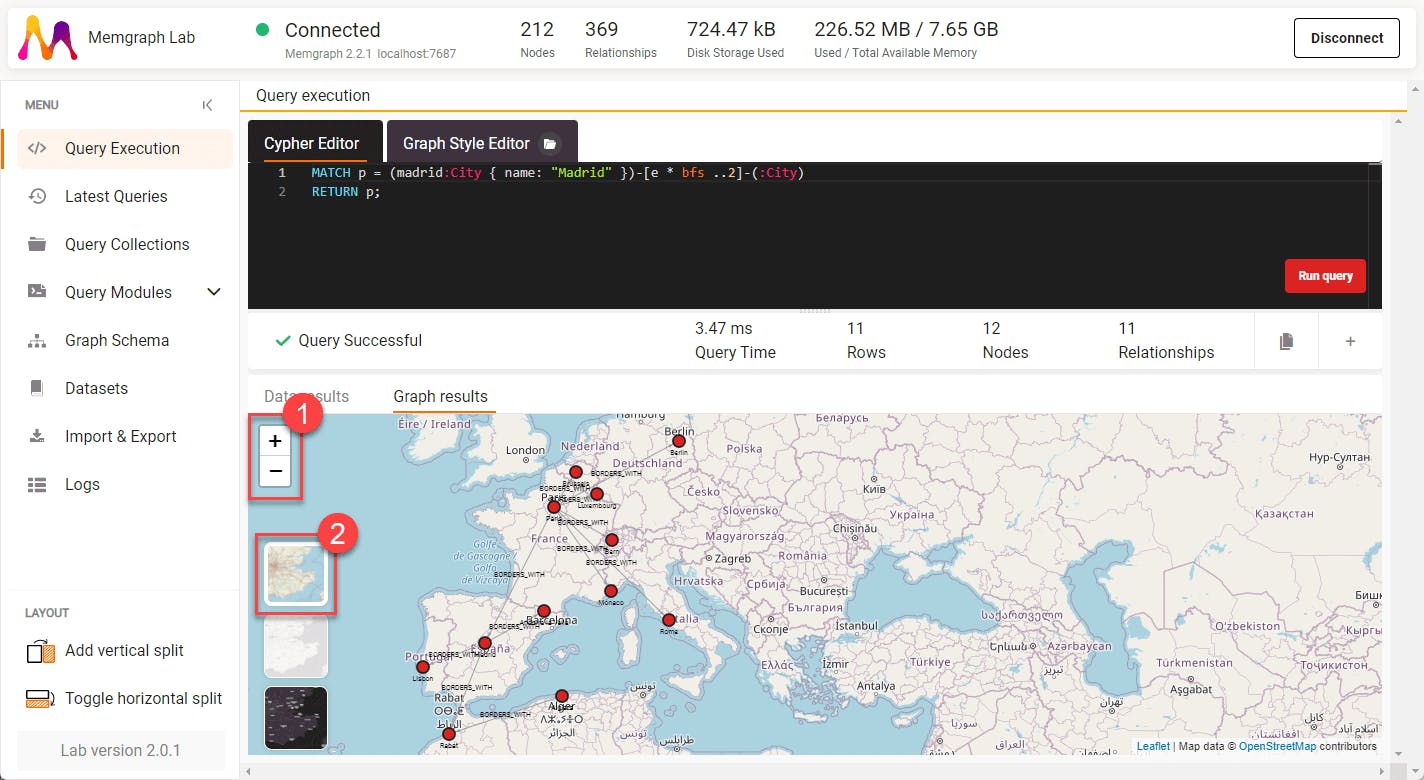
When your results are shown on the map, you can move around. Go ahead and zoom in and change the map style to Detailed.
You will now use Graph Style Editor to change how nodes and relationships are shown on the map. We have included a flag for each capital city as a node property for the country it belongs to. You will now add one line of code to change the style of the graph.
Find the part of the code that looks like this:
@NodeStyle HasLabel(node, "City") {
  color: #DD2222
  color-hover: Lighter(#DD2222)
  color-selected: Lighter(#DD2222)
}
and add the line
image-url: Property(node, "flag")
so that the above block looks like this:
@NodeStyle HasLabel(node, "City") {
  image-url: Property(node, "flag")
  color: #DD2222
  color-hover: Lighter(#DD2222)
  color-selected: Lighter(#DD2222)
}
Click Apply, and your result should look like this:

That looks great, but let's make the names of the cities and nodes a little bit bigger.
In the Graph Style Editor, locate the following code:
@NodeStyle {
  size: 6
  color: #DD2222
  color-hover: Lighter(#DD2222)
  color-selected: Lighter(#DD2222)
  border-width: 1.8
  border-color: #1d1d1d
  font-size: 7
}
and replace it with:
@NodeStyle {
  size: 10
  color: #DD2222
  color-hover: Lighter(#DD2222)
  color-selected: Lighter(#DD2222)
  border-width: 1.8
  border-color: #1d1d1d
  font-size: 12
}
You have increased the node size to 10, and the font size to 12. Now you will update the styling for the relationships. To make them thicker and change their color to red on hover, replace the following code in the Graph Style Editor:
@EdgeStyle {
  color: #999999
  color-hover: #1d1d1d
  color-selected: #1d1d1d
  width: 0.9
  width-hover: 2.7
  width-selected: 2.7
  font-size: 7
  label: Type(edge)
}
with
@EdgeStyle {
  color: #999999
  color-hover: #ff0000
  color-selected: #1d1d1d
  width: 2
  width-hover: 2.7
  width-selected: 2.7
  font-size: 7
  label: Type(edge)
}
In case you need it, here is the complete Graph Style Code:
@NodeStyle {
  size: 10
  color: #DD2222
  color-hover: Lighter(#DD2222)
  color-selected: Lighter(#DD2222)
  border-width: 1.8
  border-color: #1d1d1d
  font-size: 12
}

@NodeStyle HasLabel(node, "City") {
  image-url: Property(node, "flag")
  color: #DD2222
  color-hover: Lighter(#DD2222)
  color-selected: Lighter(#DD2222)
}

@NodeStyle Greater(Size(Labels(node)), 0) {
  label: Format(":{}", Join(Labels(node), " :"))
}

@NodeStyle HasProperty(node, "name") {
  label: AsText(Property(node, "name"))
}

@EdgeStyle {
  color: #999999
  color-hover: #ff0000
  color-selected: #1d1d1d
  width: 2
  width-hover: 2.7
  width-selected: 2.7
  font-size: 7
  label: Type(edge)
}
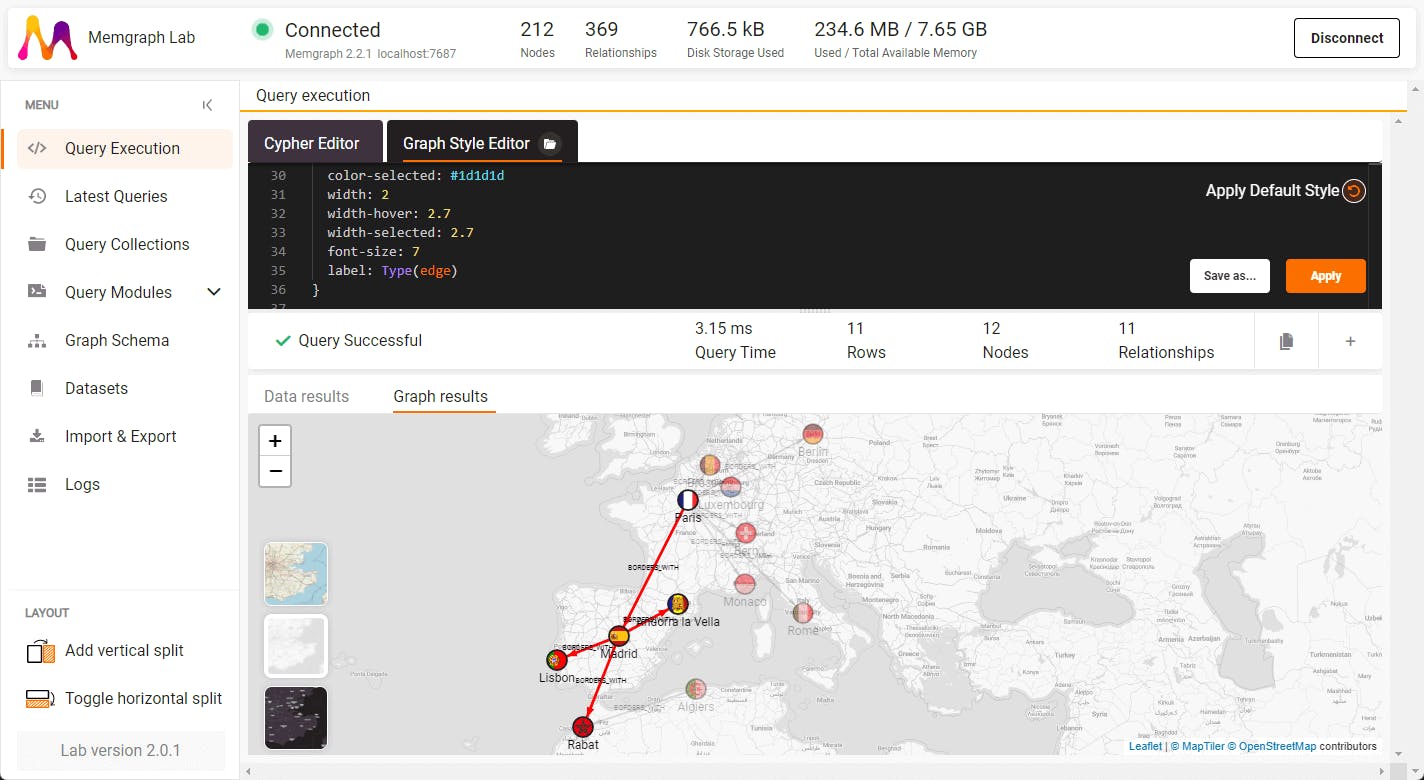
Below you can see how the graph looks like in the end. I hope that you have enjoyed this short tutorial. Now that you have seen Memgraph in action, I encourage you to keep exploring Memgraph features. A wonderful world of graphs awaits you!
Where to next?
In this tutorial, you've learned how to install Memgraph Platform, use Memgraph Lab to import a dataset, run queries and style your graph. Not bad for a start, right?
I have promised along the way some more resources, so here they are:
I hope that you had fun going through this tutorial! You can check out some of the tutorials that we have prepared for you, or you can go to Memgraph Playground and go through the guided lessons.